Quick Start Guide to Altidar
Altidar is an alternative investment analysis platform utilizing data, research, news, and analysis from SK Research and Due Diligence, LLC. We aggregate and organize the data so that it is easily accessible in charts and dashboards. The Altidar platform provides various functionalities to make researching and staying on top of alternative investments easier for financial advisors.
In this manual, you will learn some basic information about Altidar including:
-
How to navigate the platform
-
What each section of Altidar does and why you would use it
Sign Up & Sign In
To create a free account, head to www.altidar.com and click the Sign Up button. This will direct you to the application’s website, which we recommend accessing from your laptop or desktop computer.
Once you have an Altidar account, you can sign in by clicking the sign in button on altidar.com. After signing in, you will land on the “My Dashboard” screen by default. Most features on this screen will by empty until you follow at least one fund.
Navigating Altidar
The Altidar platform has four primary sections:
-
Home – list of all funds covered on the platform, industry news feed
-
My Dashboard – list of funds you follow, relevant news and filings, fund snapshot tool
-
Detailed Reports – individual fund analysis
-
Comparison Reports – comparative fund analysis
Navigate to any section using the pane on the left of the window:

You can also access the Detailed Report for a specific fund using the blue buttons in that fund’s row on the Home screen or on My Dashboard:

Home
-
See all funds covered on Altidar
-
Access a fund's Detailed Report
-
Follow a fund
-
Read industry news
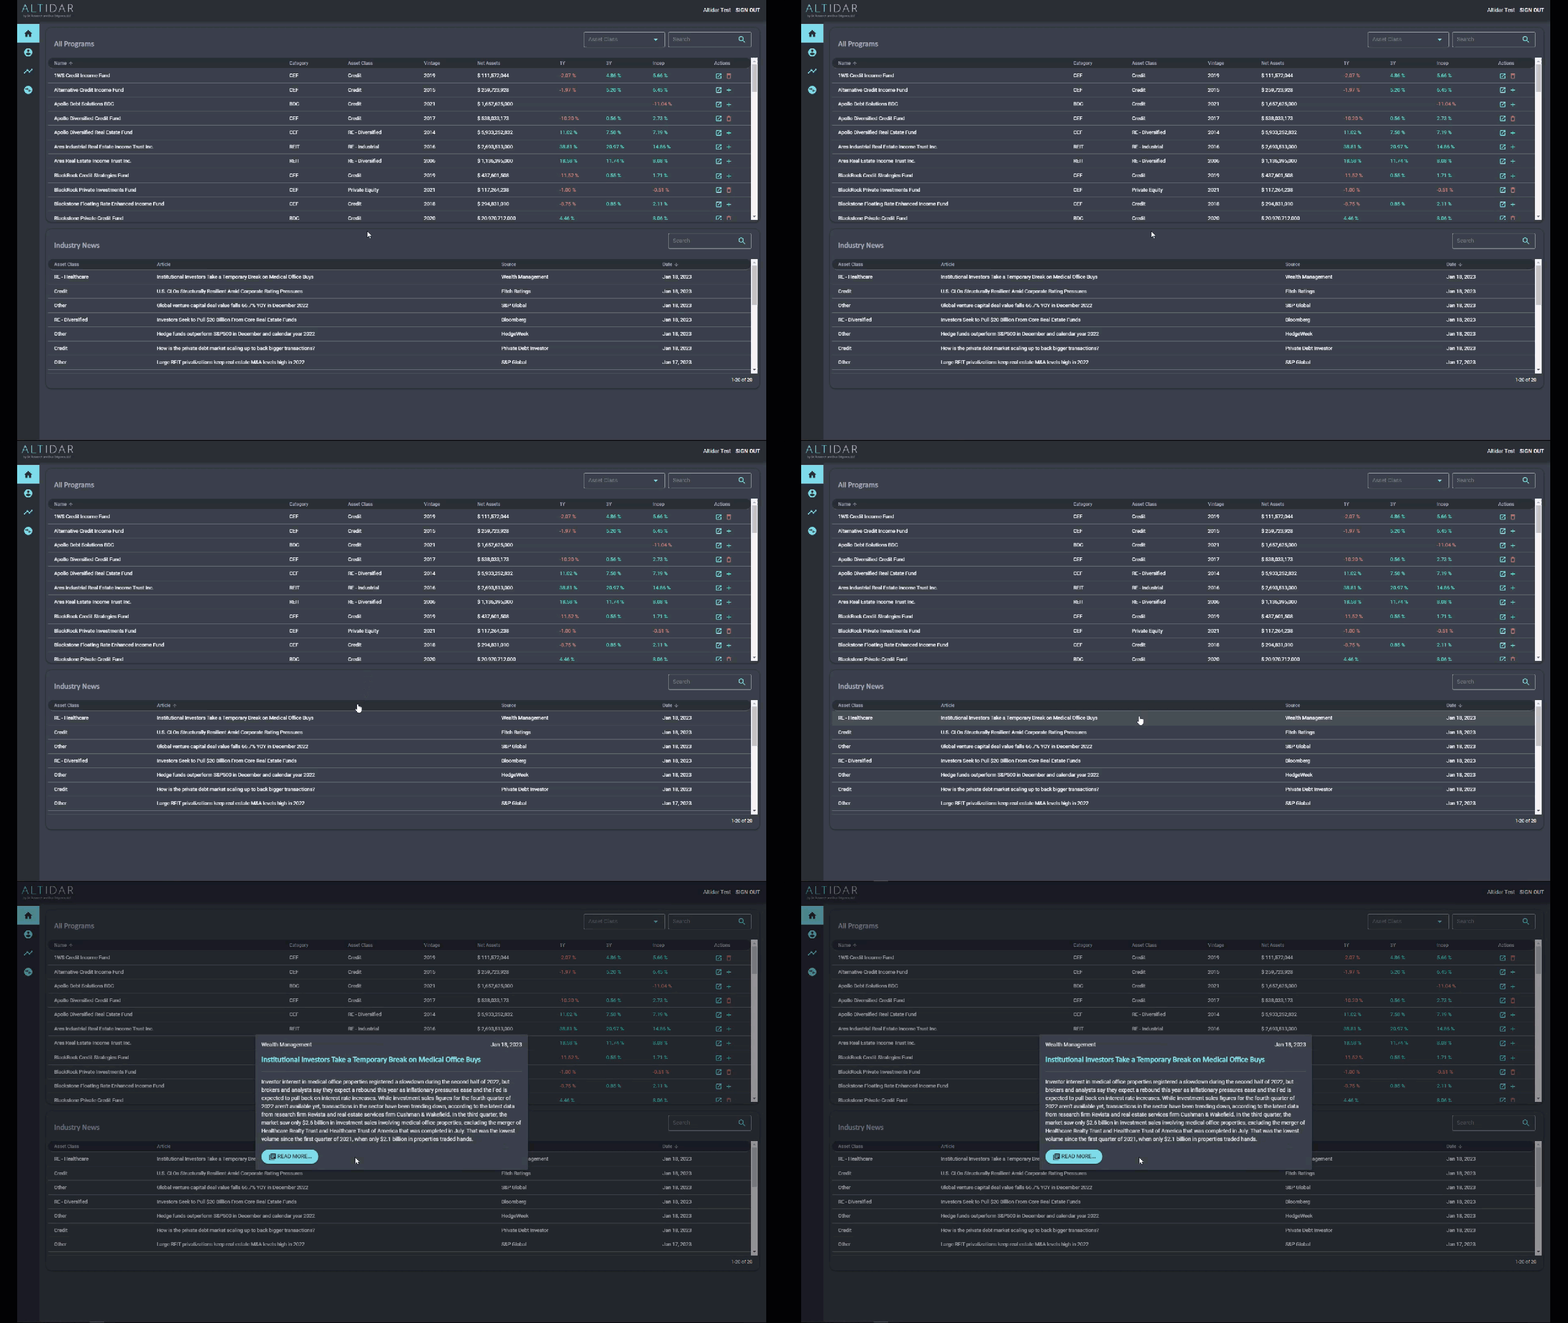
The table at the top of this screen lists all funds covered on Altidar. You can search for a fund by name, filter the table by asset class, and sort it by clicking on any column header. To follow a fund, click the Add button in that fund’s row:

The industry news feed at the bottom of the screen is curated and summarized daily. To read the article summary or access the source, click on the row for the article:

If a specific asset class is selected in the dropdown menu at the top of the screen, the newsfeed will filter based on that selection. For example, if I want to see recent news relevant to the industrial real estate industry, I would select “RE – Industrial” in the asset class filter.
My Dashboard
-
See funds that you follow
-
Access a fund's Detailed Report
-
Read fund news, SEC filings, and industry news
-
Fund Snapshots
My Dashboard lists funds that you follow at the top. To add a fund to your list without leaving the screen, use the drop-down menu at the top of the screen:

Below this table are feeds for fund news, SEC filings, and industry news based upon the funds you follow and the respective underlying asset class of each. To filter the newsfeeds for a specific fund, click the checkbox in that fund’s row:

Selecting a fund also opens the Fund Snapshot for the fund at the bottom of the screen. This feature provides you with the key data on the fund right on the screen:

Detailed Reports
-
Charts and visuals to analyze individual funds
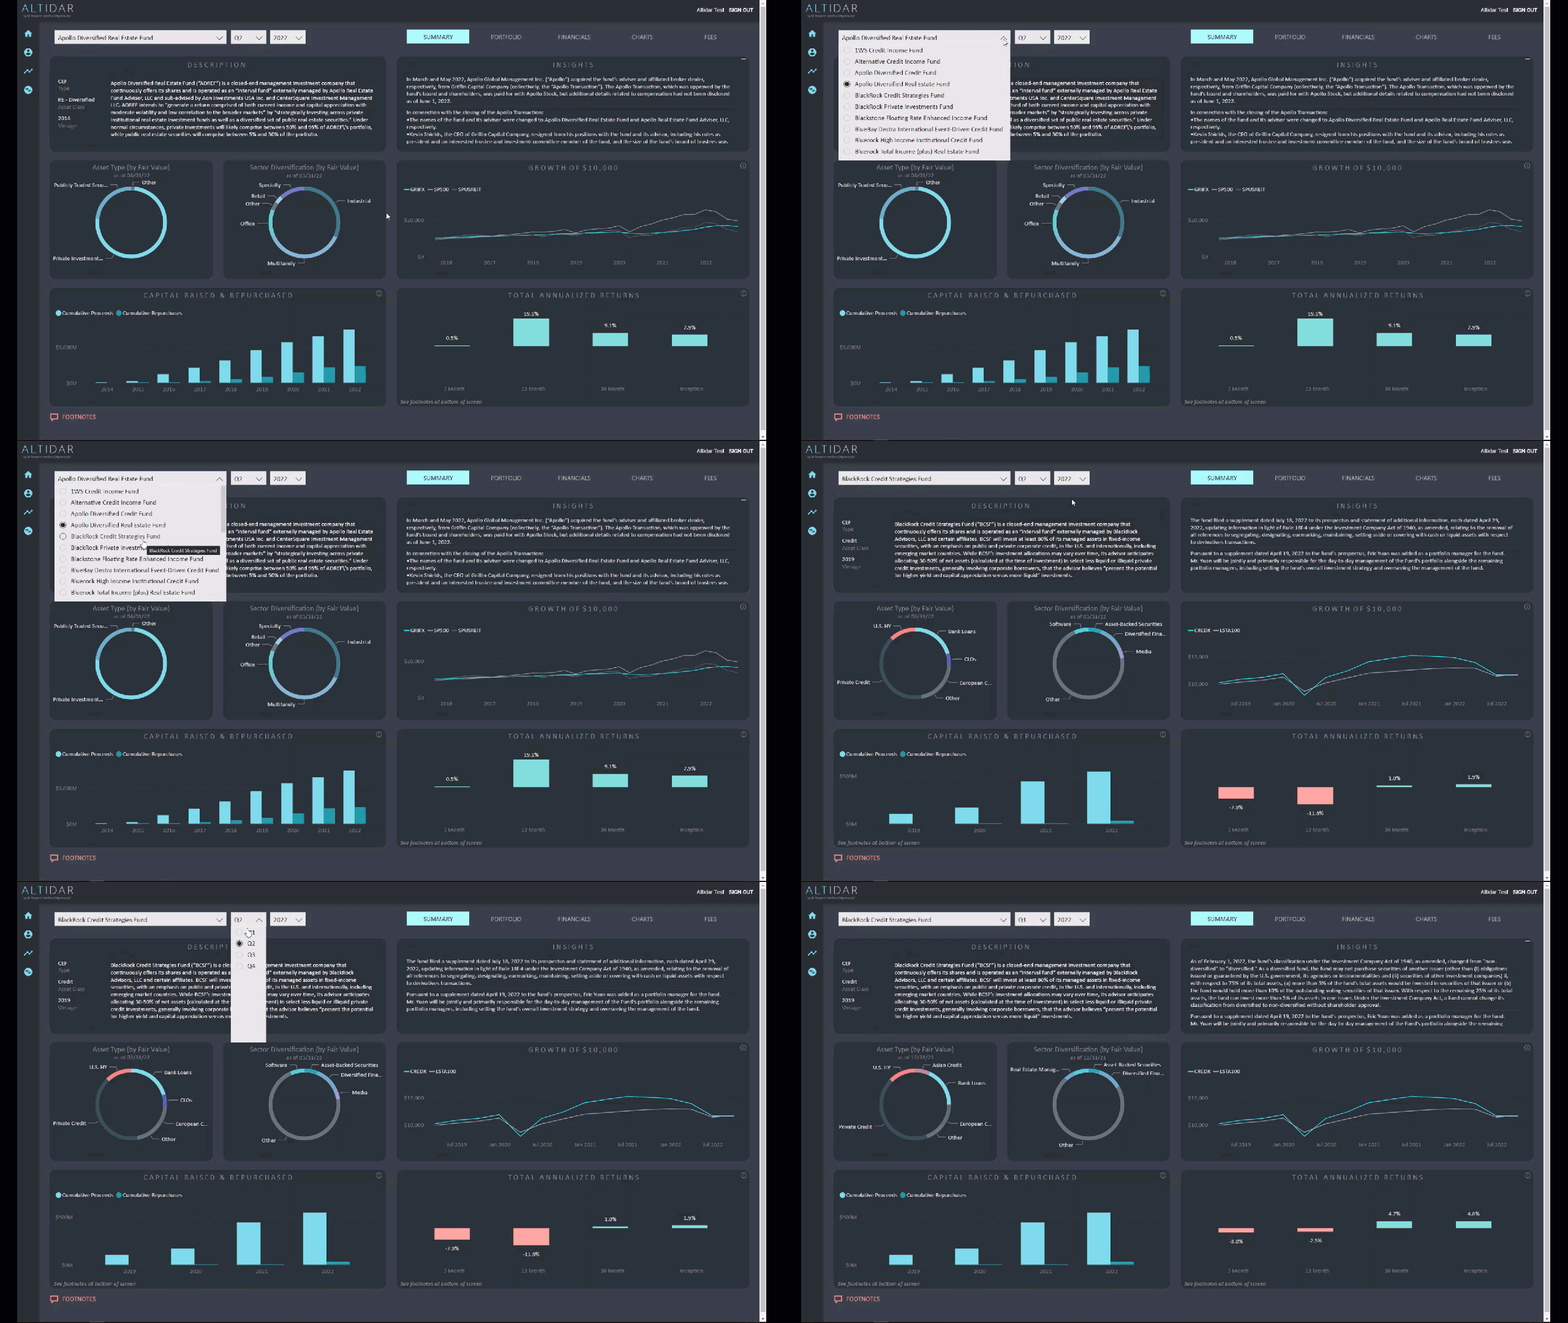
Altidar Detailed Reports include five dashboards to guide you through an individual fund’s analysis:
-
Summary
-
Portfolio
-
Financials
-
Charts
-
Fees
Each fund structure has its own Detailed Report. To change the fund or period presented in the report, use the dropdown menus at the top of each dashboard:

You can hover over certain visuals to see the underlying data:

In the top right corner of certain visuals, you'll find information buttons. Clicking these opens up a description to provide additional context on what is being presented in the visual:

Footnotes may be added to visuals when additional fund-specific context is necessary. In these instances, (i) a message appears in the bottom left corner of the visual, and (ii) a red footnote button will appear in the bottom left corner of the screen. Clicking the red button will open the footnotes.
Comparison Reports
-
Charts and visuals to compare funds
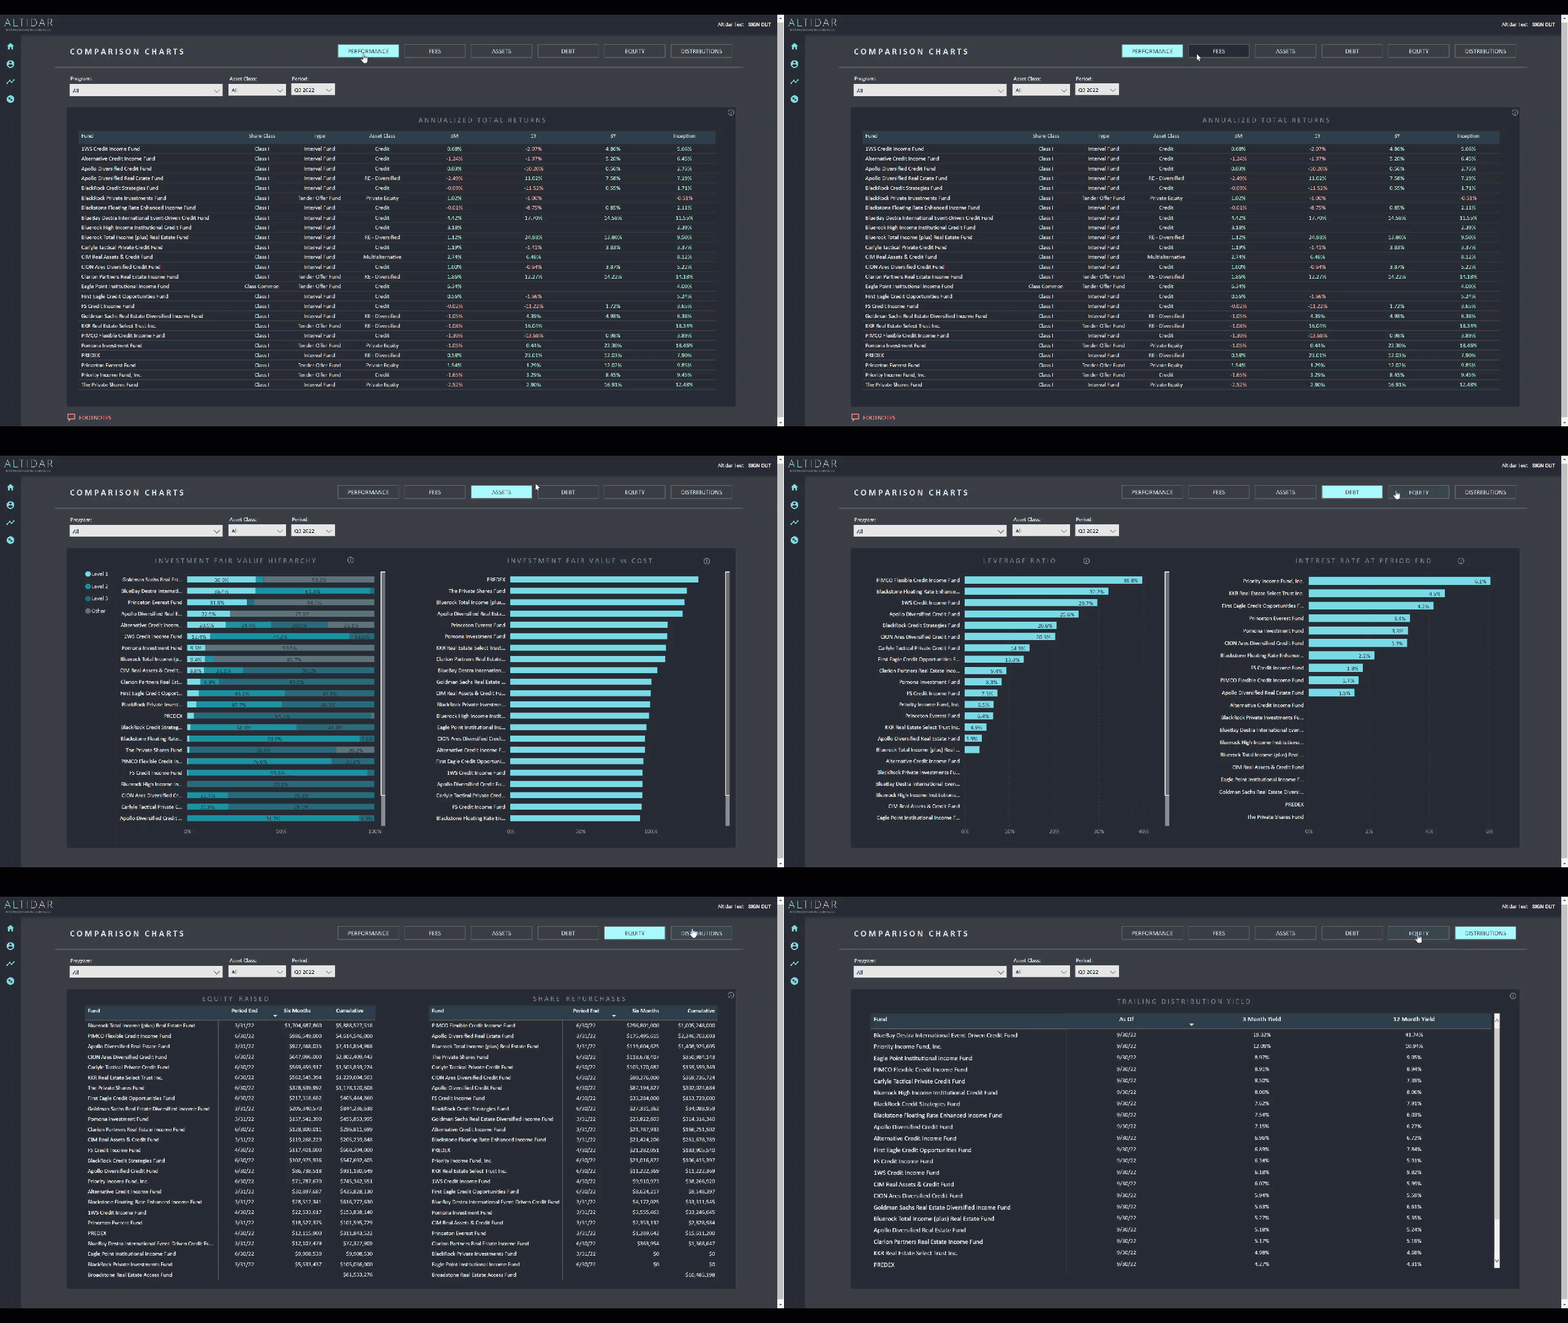
Each Comparison Report has six dashboards:
-
Performance
-
Fees
-
Assets
-
Debt
-
Equity
-
Distributions

By default, the Comparison Report dashboards show all funds covered within that structure, however, the report can be filtered only display information for a subset of funds:
